The monitoring system is based on the processing of multi-temporal satellite images acquired from Sentinel-2 and Landsat-7 and -8 platforms using the open-source framework CoastSat (Vos et al., 2019). For each analysed site, the shoreline position is automatically extracted through a sub-pixel classification algorithm. The result is a shoreline position time series with the following characteristics:
extracted on transects orthogonal to the coast generated at regular intervals of 200 m;
temporal coverage starting from 2016;
nominal resolution resampled to monthly.
The time series analysis is therefore aimed at classifying erosion and recovery events.
Detection of erosion-recovery cycles
The time series are subjected to an analysis pipeline that includes:
temporal resampling and interpolation of missing values;
noise filtering via adaptive smoothing (LOWESS, Savitzky-Golay, moving average, gaussian-fitting);
automatic detection of erosion-recovery cycles, defined as the sequence:
preceding local maximum — pre-erosion beach condition;
local minimum whose position from the reference exceeds a configurable percentile threshold (default P25 of the smoothed values distribution);
subsequent local maximum — recovery phase.
Events are detected on the smoothed series and validated on the raw series, with optional threshold management via moving window, linear detrending or relative prominence criterion.
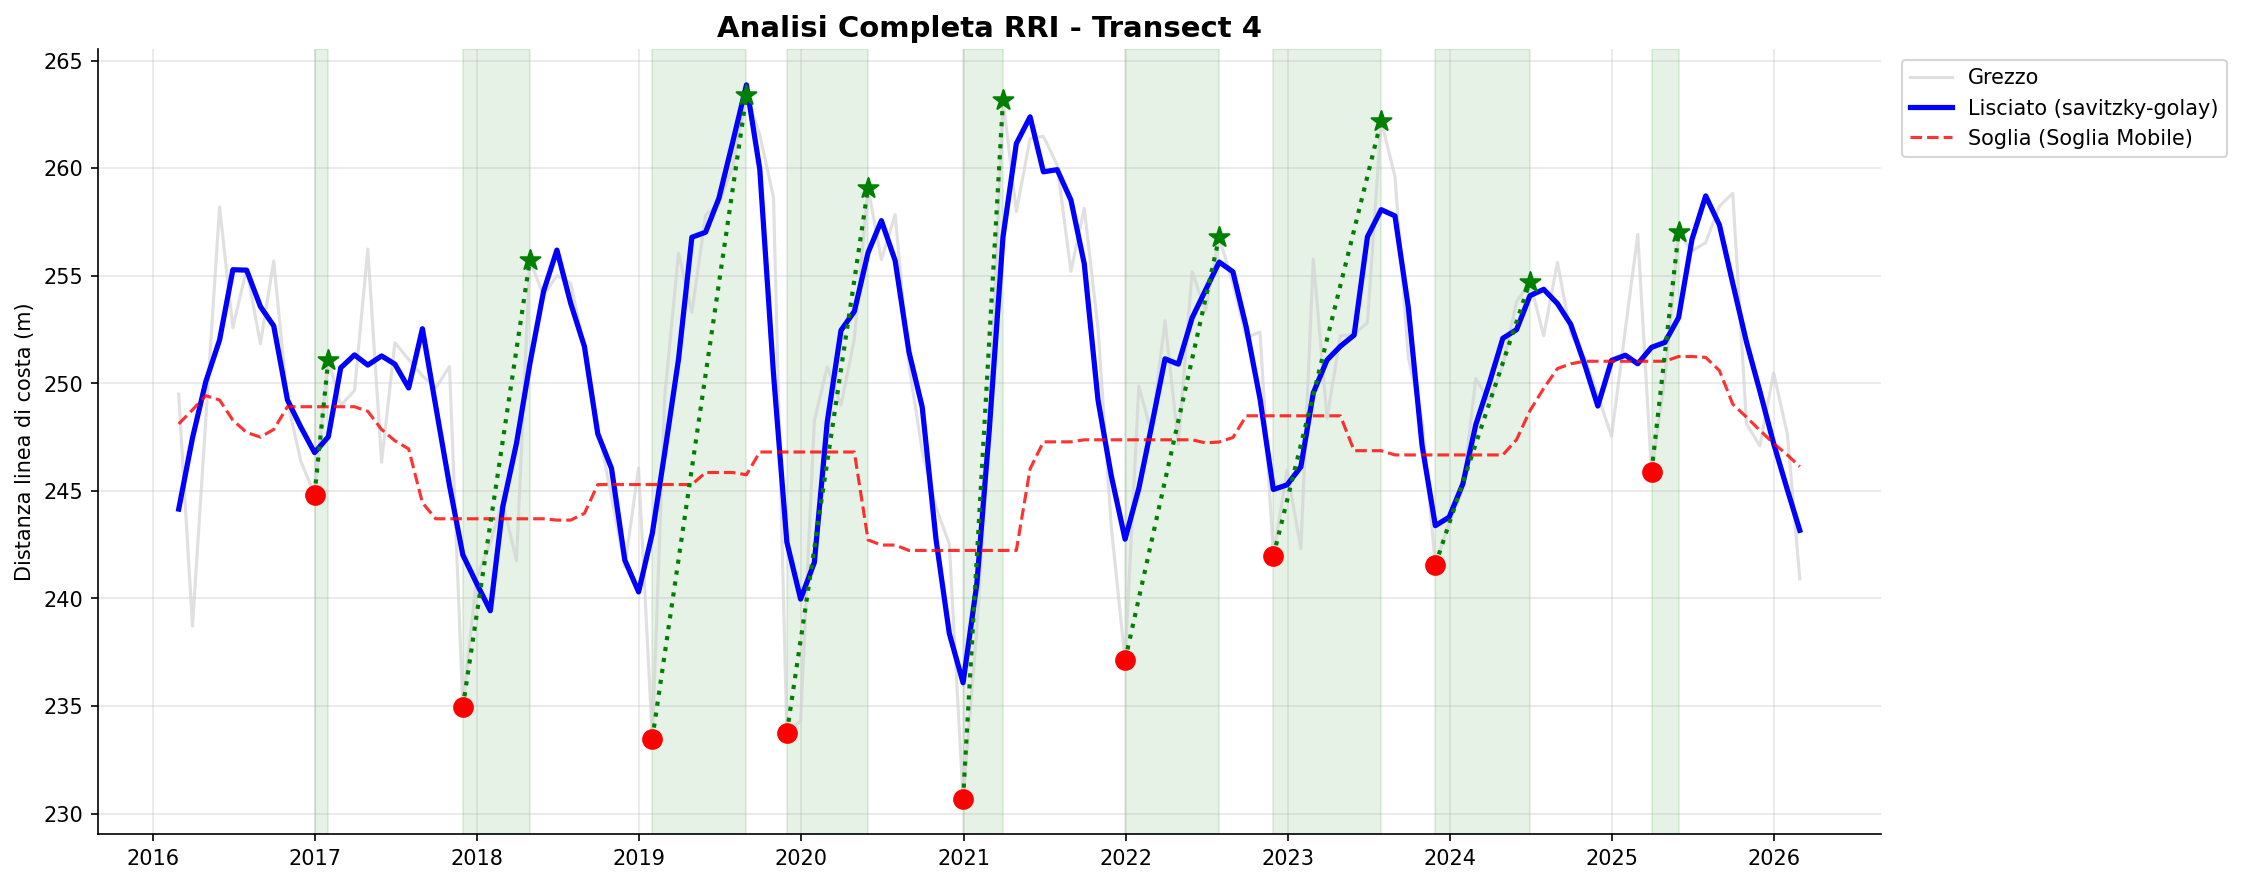
How to read the transect charts
Clicking on a transect in the map below opens the time series chart of shoreline distance from a reference (figure below as an example).
Example chart showing beach recovery events
The table below summarises the description of the elements displayed in the chart.
⎯⎯ Grey line
— Raw monthly series: shoreline distance from the reference (landward end of the measurement transect), in metres. Reflects high-frequency variability including instrumental noise.
⎯⎯ Blue line
— Smoothed series: filtered version of the raw series via adaptive smoothing. Highlights the medium-to-long-term morphological signal, attenuating seasonal variability and noise.
- - Dashed red line
— Erosion threshold: percentile value (default P25) calculated on the smoothed series, fixed or moving over time. Minima below this threshold are considered significant erosion events.
● Red dots
— Erosion minima: instants at which the shoreline distance (from the reference) reaches the minimum value of the erosion event, corresponding to the peak of shoreline retreat.
★ Green stars
— Recovery maxima: instants at which the beach reaches its maximum advance following the erosion event, indicating completion of the morphological recovery phase.
⎯⎯ Dashed green line
— Recovery trajectory: segment connecting the erosion minimum with the subsequent recovery maximum, indicating direction and amplitude of the recovery.
▬ Green areas
— Recovery windows: time intervals between the erosion minimum and the subsequent maximum. Width indicates cycle duration; faster cycles correspond to narrower areas.
Together with the chart, a table is produced reporting for each erosion/recovery cycle: